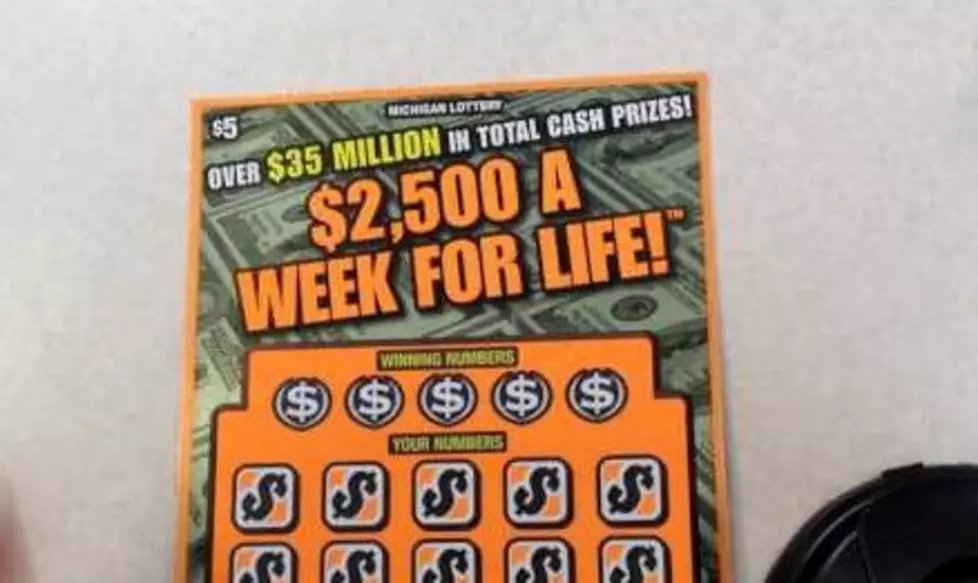
Experiment Involving Picking Winning Scratch Off Lottery Tickets
Well, in this video at least it's a 50% success rate. Your mileage may vary of course.
So after a short conversation about how you can compare the number of prizes allocated vs claimed in the scratch off lottery. I tried to excel and very basic math to buy a winning lottery ticket.
Granted I have less in my pocket than I started with, but hey, that's gambling.
Not videoed were the other two tickets I bought that were losers as well. One I didn't get in the shot very well, and I honestly just didn't understand how I was supposed to win (I still don't know what I'm supposed to do in the 300 grand word find ... it completely confounded me) so I had to edit out. I scanned the barcode and the machine told me I wasn't a winner so I left it at that. The other was the $500 a week one which had pretty good number of winners out there too. I bought that with one of the $5 I won on the 2500 card after turning it in. No luck.
As The logic of why I picked the tickets I did: I was looking at a combination of the percentage of remaining prizes verses how long the tickets have been for sale.
Not surprisingly the tickets that are new to market had like 95% of winners still out there and the ones that are like 3 years old have like 15% remaining.
These had a relatively high percentage of winning tickets till out there even after being out there a year.
I'm pretty sure the basis of my mathematics are WAY off.
But then I know of people who pick their lottery tickets on if a chicken eats out of a blue bowl are red bowl.
People are weird.
More From 98.7 WFGR


![Terrifying Wind-Aided New York City Crane Collapse Kills One [VIDEO]](http://townsquare.media/site/757/files/2016/02/Crane.jpg?w=980&q=75)


![Meet Melanie, The Helpful Raccoon [Video]](http://townsquare.media/site/46/files/2016/02/hqdefault11.jpg?w=980&q=75)